Combining sampling from multiple trials
Learning objectives
Analyze combined umbrella sampling for a 1-dimenional reaction using NDFES to generate a PMF from multiple trials
Relevant literature
Generating a combined PMF
Often times one may break sampling into mulitple trials and create a PMF based on the total combined sampling. .You have been provided the output multiple trials that must be copied to the working directory.
Create a directory called combined_analysis.
List the contents of your working directory. It should be structured as follows:
[user@cluster] cp -r /expanse/projects/qstore/amber_ws/tutorials/QMMM_DFTB3_MTR1/1D/ouputs/t{2..8} ./
[user@cluster] ls
combined_analysis  t1  t2  t3  t4  t5  t6  t7  t8
The structur files have been removed from the output directories for the sake of file size, but these would have been generated by the simulations and are not required for analysis. We want to combine the metafiles from all of the trial directories.
Run the following command to generate metafile.all:
[user@cluster] cd combined_analysis
[user@cluster] ndfes-CombineMetafiles.py -o metafile.all ../t{1..8}/analysis/metafile
Run the following command to generate metafile.all.chk:
[user@cluster] ndfes_omp --mbar -w 0.15 --nboot 0 -c metafile.all.chk metafile.all
This will generate metafile.all.chk. Finally, we will generate the path file for the entire PMF.
Run the following command to generate the path file:
[user@cluster] ndfes-path_omp --chk metafile.all.chk --ipath metafile.all --npathpts 32 --nsplpts 400 --opath path_all
The ndfes commands are also given in combined_analysis.sh, but for the sake of understanding the role of each program they have been run one at a time.
Plot the PMF with xmgrace:
[user@cluster] xmgrace -block path_all.rbf.0.dat -bxy 3:4
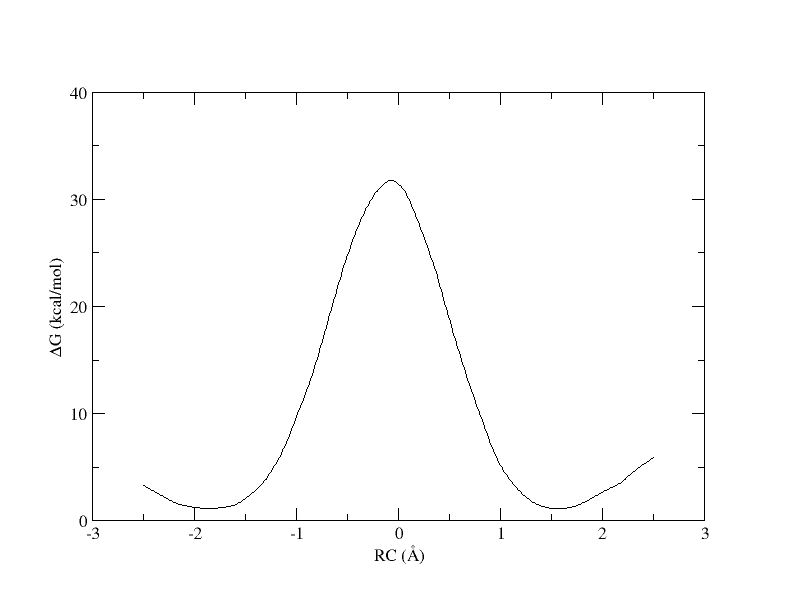
Figure 3. PMF as a function of reaction coordinate value from simulation of all 32 umbrella windows.
Now we can see the full PMF. From this we see that the free energy barrier for this reaction is ~30 kcal/mol, which is quite high. In 1 dimension it is very clear what the path is from reactants to products, and we can plot the free energy as a function of a single coordinate. However, if more reaction coordinates are involved, the path from reactant to product is less clear. In the following sections you will see how the use of more reaction coordinates can better model this reaction.