Additional exercise: Demonstrating the impact of umbrella window spacing
Learning objectives
Demonstrate the imporance of phase space overlap between windows for analyzing umbrella sampling simulations
Relevant literature
Analyze different windows spacings
In this section you will demonstrate the importance of the spacing between umbrella windows. You have been provided the directory test_spacing containing metafile.11.
Take a look at metafile.11:
0 298.00 ../t1/analysis/dumpaves/img01.dumpave    -2.500000    1.00000000000000e+02
0 298.00 ../t1/analysis/dumpaves/img04.dumpave    -2.016129    1.00000000000000e+02
0 298.00 ../t2/analysis/dumpaves/img07.dumpave    -1.532258    1.00000000000000e+02
0 298.00 ../t3/analysis/dumpaves/img10.dumpave    -1.048387    1.00000000000000e+02
0 298.00 ../t4/analysis/dumpaves/img13.dumpave    -0.564516    1.00000000000000e+02
0 298.00 ../t4/analysis/dumpaves/img16.dumpave    -0.080645    1.00000000000000e+02
0 298.00 ../t5/analysis/dumpaves/img19.dumpave     0.403226    1.00000000000000e+02
0 298.00 ../t6/analysis/dumpaves/img22.dumpave     0.887097    1.00000000000000e+02
0 298.00 ../t7/analysis/dumpaves/img25.dumpave     1.370968    1.00000000000000e+02
0 298.00 ../t7/analysis/dumpaves/img28.dumpave     1.854839    1.00000000000000e+02
0 298.00 ../t8/analysis/dumpaves/img31.dumpave     2.338710    1.00000000000000e+02
This is is the same as metafile.all used previously for combined analysis except it only contains 11 of the umbrella windows. Make note of the spacing between the reaction coordinate values in the fourth column of metafile.11 compared to in metafile.all. They are now spaced by ~0.5 . First we will attempt to use this metafile in the same way we did previously.
Run the following ndfes commands to generate the chk and path files:
[user@cluster] ndfes_omp --mbar -w 0.15 --nboot 0 -c metafile.11.0.15.chk metafile.11
[user@cluster] ndfes-path_omp --chk metafile.11.0.15.chk --ipath metafile.11 --npathpts 11 --nsplpts 400 --opath path_11_spl_0.15
Plot the PMF in xmgrace:
[user@cluster] xmgrace -block path_11_spl_0.15.rbf.0.dat -bxy 3:4
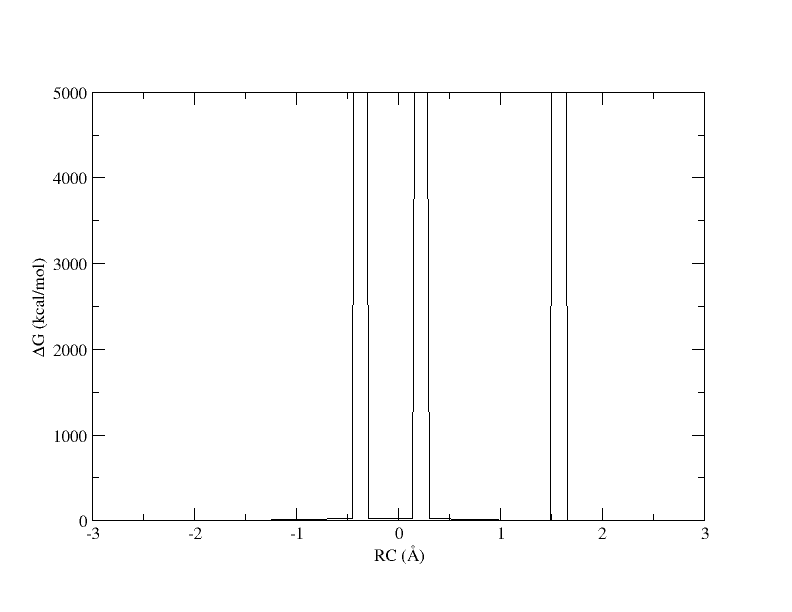
Figure 4. PMF as a function of reaction coordinate value from simulation of 11 umbrella windows analyzed with a 0.15. The free energy is interpolated with 400 spline points. bin width.
The x-axis is the reaction coordinate value and the y-axis is the free energy in kcal/mol. Something has gone horribly wrong and the free energy has shot up to 5000 in 3 places. When we ran the ndfes_omp command to create the chk file, we used -w 0.15, meaning the bin width when solving the MBAR/UWHAM equations was 0.15 . However, our windows are now spaced ~0.5 apart. In our disang file we set the force constants to be 100 kcal/mol 2. Given our harmonic biasing potential, the distribution of observed reaction coordinates should be approximately normally distributed with a standard deviation of σ=(1/2βK)1/2 where β is the one over the Boltzmann constant times temperature and K is the force constant set in the disang file. Setting rk2 and rk3=100 gives an expected standard deviation in the reaction coordinate of ~0.054 . In a normal distribution, about 99.7% of the samples will be within 3 standard deviations of the mean, which here is ~0.16 . If the windows are ~0.5 away from each other and the sampling spans ~0.16 around the mean, it is highly likely that there will be bins between windows that contain zero samples.
When a bin contains no samples, ndfes reports 5000 for the energy, which effectively indicates it is infinitely high because a calculation could not be made. When we ran ndfes-path_omp we set –nsplpts to 400 in an attempt to create a smooth spline interpolation through the data, but this meant interpolating through empty bins. Now let’s try running the command again without interpolating. This will just return the free energy at the 11 path points.
Run the following ndfes command:
[user@cluster] ndfes-path_omp --chk metafile.11.0.15.chk --ipath metafile.11 --npathpts 11 --opath path_11_0.5
Plot the result in xmgrace:
[user@cluster] xmgrace -block path_11_0.5.rbf.0.dat -bxy 3:4
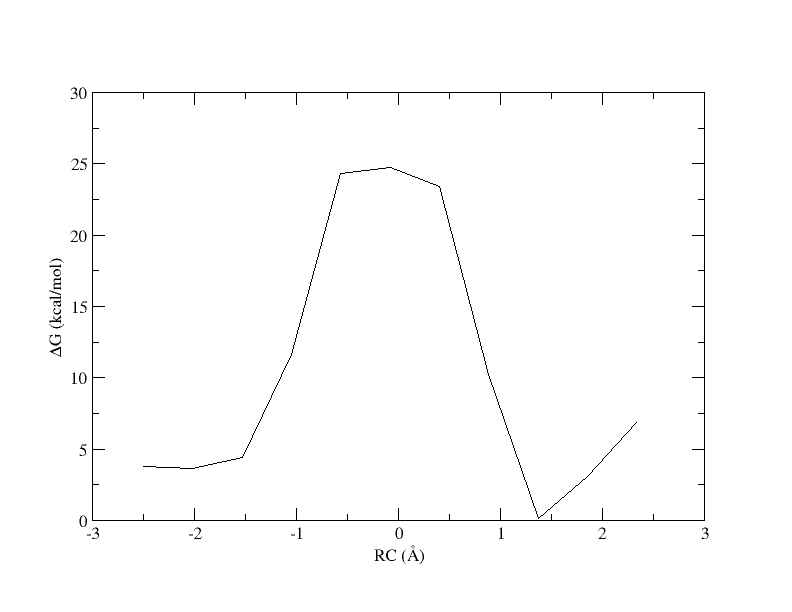
Figure 5. PMF as a function of reaction coordinate value from simulation of 11 umbrella windows analyzed with a 0.15 bin width without spline interpolation.
Now the energy is more reasonable, but the PMF is disjointed. Perhaps is we increase the bin width, there will be no empty bins and we will be able to smoothly interpolate the PMF.
Run the ndfes commands again, but increase the bin width from 0.15 to 0.3 :
[user@cluster] ndfes_omp --mbar -w 0.3 --nboot 0 -c metafile.11.0.3.chk metafile.11
[user@cluster] ndfes-path_omp --chk metafile.11.0.3.chk --ipath metafile.11 --npathpts 11 --nsplpts 400 --opath path_11_spl_0.3
Plot the result in xmgrace:
[user@cluster] xmgrace -block path_11_spl_0.3.rbf.0.dat -bxy 3:4
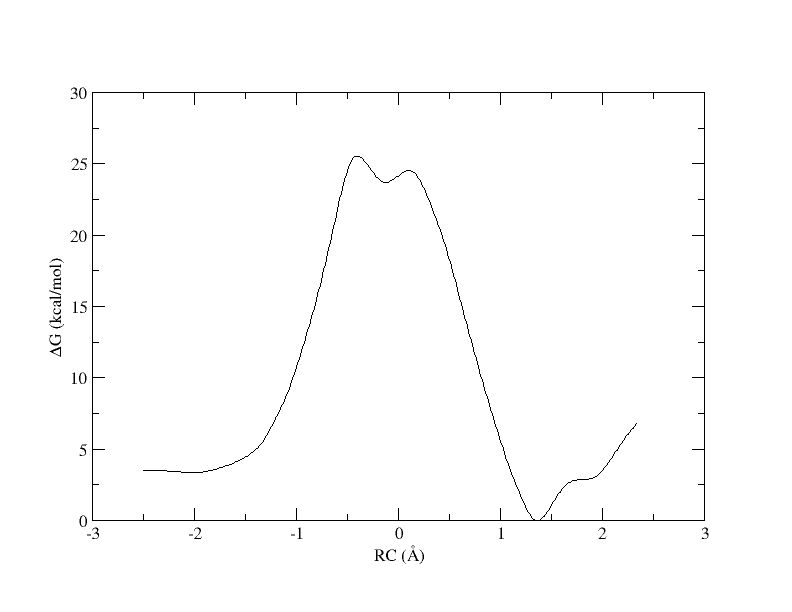
Figure 6. PMF as a function of reaction coordinate value from simulation of 11 umbrella windows analyzed with a 0.3 bin width. The free energy is interpolated with 400 spline points.
Recall that with 32 windows, the PMF looked like this:
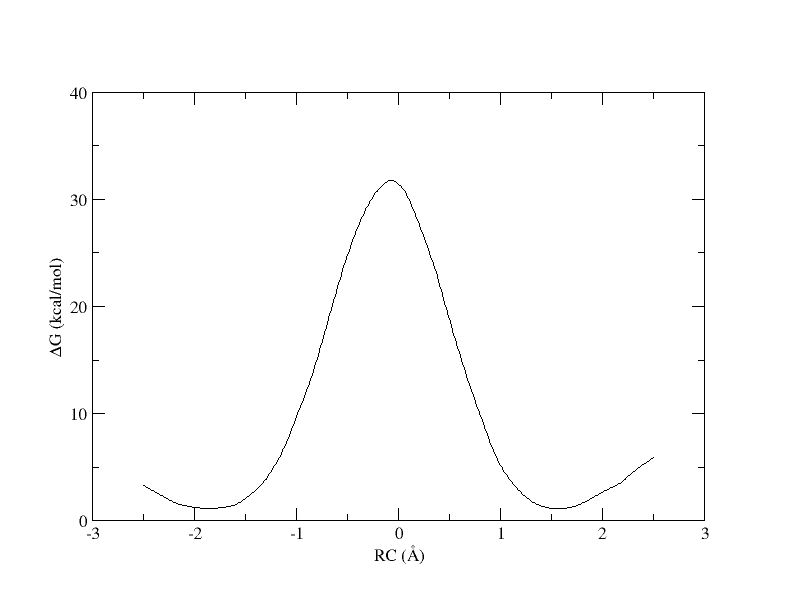
Figure 7. PMF as a function of reaction coordinate value from simulation of all 32 umbrella windows.
As you can see, we were able to make an interpolation, but the PMF is very noisy. All of the bins contain samples, but for many it is not enough to reliably interpolate. In addition, increasing the bin size creates a more course gained view of the free energy landscape. In the end, we simply need more sampling, which is achieved by using more umbrella windows.