Finding a minimum free energy path using the Surface Accelerated String Method (SASM)
Learning objectives
Find the minimum free energy path for a 2D reaction within MTR1 using the SASM
Relevant literature
Introduction
Insert Download link
There are 3 sub-directories we will look at: linear, PT, and MT. Each contains input and output. The inputs should be copied to your working directory. If you are unable to produce an output for a given step, copy it from the output directory in order to proceed. There will be times when a calculation has been performed for you and you will do analysis. In these cases, where indicated, you will copy the outputs to your working directory and analyze them.
Given that the barrier to methyl transfer was so high, we will now include an additional coordinate for proton transfer. This evaluates the potential impact of general acid catalysis on the mechanism and free energy profile. However, with this new degree of freedom, it is unclear what the minimum free energy path is to get from reactants to products, so we need a method to navigate the multidimensional free energy landscape.
In this section you will analyze data from a series of surface accelerated string method (SASM) simulations that sample the reaction space with two reaction coordinates: RC1 = |RC10:N3-H| - |RmG:N1 - RH| and RC2 = |RO6mG:O6 - RCm| - | RA63:N1 - RCm |. The process of generating the inputs and equilibrating the windows for two dimensions would be analogous to the 1D example, except another reaction coordinate is specified in the img.disang file, and adequate window spacing must be maintained in both dimensions. The set-up for these simulations has been done for you, and you will focus on analysis of the free energy surface.
The inputs for the sting simulations and resulting outputs are located in the 2D directory.
The surface accelerated string method is an iterative procedure starting from an initial guess of the path that seeks to convergence upon the minimum free energy path. This method converges rapidly by running a set of umbrella sampling simulations on a given path, and after each iteration optimizing the path on the collective free energy surface from all of the sampling iterations performed up to that point. Every other string iteration, it performs “exploratory” simulations where the umbrella centers are placed just beyond the point on the minimum free energy path to thoroughly sample the vicinity of the path to avoid falling into local minima and create a rigorous free energy surface.
Running SASM simulations
Since reaction path finding can be a lengthy process, the simulation data has been provided for you, and you will perform analysis. First, let’s take a look at how the data was generated. There are 3 simulation directories provided called PT, MT, and linear. These correspond to 3 initial guesses of the path from which the pathfinding was initiated. PT is a stepwise pathway where the proton is transferred followed by the methyl transfer in a perfectly stepwise fashion. MT follows the opposite pathway where the methyl transfer occurs first and the proton transfer occurs second. The linear pathway is a perfectly concerted mechanism where the path is a straight line from reactants to products. At the offset, it is unclear which pathway is most energetically favorable. The activity will use the linear path as the example.
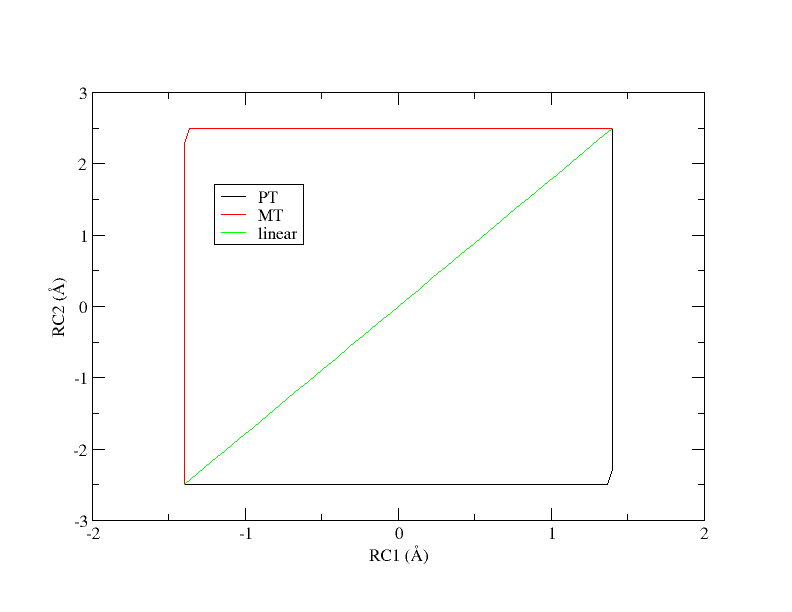
Figure 8. Initial guesses of the minimum free energy path from reactant (lower left corner) to product (upper right corner).
Chose one of the paths to work with for the exercise and copy the inputs to your working directory.
[user@cluster] mkdir linear
[user@cluster] cd linear
[user@cluster] cp -r /expanse/projects/qstore/amber_ws/tutorials/QMMM_DFTB3_MTR1/2D/linear/input/* ./
In the simulation directory, there is a script called SASM.slurm that was used to generate the data provided to you. The script was set up to run 51 iterations of the string method, each simulation for 4 ps. We will briefly take a look at key lines in the file that are fundamental to using the SASM. First,
MAKEANA="ndfes-path-analyzesims.py --curit=${cit} -d ${DISANG} ${NEQIT} ${TEMP} --maxeq=0.25 --skipg"
Once you have run a set of simulations, this command acts a wrapper for ndfes-CheckEquil.py, ndfes-PrepareAmberData.py, and ndfes-CombineMetafiles.py. It will determine the equilibration region of the simulations up to a fraction of maxeq, and analyze the dumpave files in that region. The resulting metafile will contain data from the current string and previous string iterations, excluding NEQIT iterations. Next, the combined metafile is used to generate the chk file:
MAKECHK="ndfes_omp --mbar -w 0.15 --nboot 0 -c metafile.all.chk metafile.all"
This command remains the same from the 1D example we did previously. Finally, the next string iteration directory is generated using the following command:
MAKESIMS="ndfes-path_omp --curit=${cit} -d ${DISANG} -i ${MDIN} ${NEQIT} ${TEMP} --sasm --maxit=300 --minsize=10 --akima --npathpts=100 --wavg=4 --wavg-niter=1"
This ndfes command optimizes the path on the existing free energy surface in order to determine where the next set of umbrella centers should be placed. The optimization is done by performing up to maxit so called “synthetic iterations” of the string method using npathpts. This optimization essentially decouples the minimum free energy path from the simulated umbrella centers so that the path can be more rigorously represented, and the simulations are performed to improve the quality of sampling. The minsize parameter indicates that a bin should have at least 10 samples to be included in the analysis. The parameter wavg is the order of the cardinal B-spline used to approximate the free energy surface as a weighted average of nearby bin values. The wavg-niter parameter applies an iterative correction to the wavg histogram values such that the interpolated values match the values at the bin centers. Increasing this value will decrease artifacts from averaging, but it may lead to noisier data. These values can be adjusted based on the system and desired smoothness of the free energy surface. Based on the optimized path, the MAKESIMS command will determine the next set of umbrella centers, and it will set up the next run directory based on the template input file and disang file provided.