12. Hands-On Session 12: Apply indirect AFE “book-ending” approach to efficiently correct low-level MM force field results to high-level QDπ
12.1. Learning objectives
Use sander to perform MM-to-QM/MM equilibrium simulations
Analyze the simulations to calculate a free energy correction
Use sander to perform MM-to-QM/MM nonequilibrium simulations
Analyze the simulations to calculate a free energy correction
12.2. Activities
        flowchart TB

  subgraph EQ["Equilibrium Bookending"]
  direction LR

      A1["inputs<br/>vac.parm7<br/>init.rst7<br/>mdin files<br/>groupfiles"]

      P1{{"<b>[§12.2.2.1]</b><br/>sander.MPI"}}
      O1["<b>[from §12.2.2.2]</b><br/>mm.0.00.rst7<br/>mm.0.00.nc<br/>qm.0.00.rst7<br/>qm.0.00.nc"]
      O2["<b>[from §12.2.2.2]</b><br/>mm.0.00.mdout<br/>qm.0.00.mdout"]

      A1 --> P1
      P1 --> O1
      P1 --> O2

      P3{{"<b>[§12.2.2.3]</b><br/>edgembar-bookend2dats.py"}}
      O3["<b>[from §12.2.2.3]</b><br/>efep_{traj}_{ene}.dat<br/>"]
      P4{{"<b>[§12.2.2.3]</b><br/>edgembar"}}
      O4["<b>[from §12.2.2.3]</b><br/>mm~qmmm.html<br/>"]

      O2 --> P3
      P3 --> O3
      O3 --> P4
      P4 --> O4

  end

  subgraph NEQ["Non-Equilibrium Bookending"]
  direction LR

      A2["MM_MD trajectory<br/>MM.nc"]
      P5{{"<b>[§12.2.3.1]</b><br/>cpptraj"}}
      O5["per frame rst7 files"]

      A2 --> P5
      P5 --> O5

      A3["vac.par7<br/>mm.mdin<br/>groupfile"]
      P6{{"sander.MPI"}}
      O6["mm.rst7<br/>tmpmm.nc<br/>qm.rst7<br/>tmpqm.nc"]
      O7["mm.mdout<br/>qm.mdout"]

      O5 --> P6
      A3 --> P6
      P6 --> O6
      P6 --> O7

      P7{{"<b>[§12.2.3.4]</b><br/>edgembar-bookend2dats.py"}}
      O8["<b>[from §12.2.3.4]</b><br/>efep_{traj}_{ene}.dat<br/>"]
      P8{{"<b>[§12.2.3.4]</b><br/>edgembar"}}
      O9["<b>[from §12.2.3.4]</b><br/>mm~qmmm.html<br/>"]

      O7 --> P7
      P7 --> O8
      O8 --> P8
      P8 --> O9

  end

  EQ ~~~ NEQ

  classDef file fill:#fff7e6,stroke:#d98c00,stroke-width:1.5px,color:#111;
  classDef program fill:#e8f1ff,stroke:#1f77b4,stroke-width:1.8px,color:#111;
  classDef result fill:#eaf7ea,stroke:#2ca02c,stroke-width:1.5px,color:#111;

  class A1,A2,A3 file;
  class P1,P3,P4,P5,P6,P7,P8 program;
  class O1,O2,O3,O4,O5,O6,O7,O8,O9 result;

  style EQ fill:#f8fbff,stroke:#1f77b4,stroke-width:2px
  style NEQ fill:#fffaf3,stroke:#d98c00,stroke-width:2px
12.2.1. Accessing the Tutorial Files
To get the tutorial data during the workshop, you can get a copy into your scratch with this command.
DataDir="/data/amber26/TutorialData/HandsOn12_Bookending"
TutorialDir="/scratch/$USER/TutorialData/HandsOn12_Bookending"
mkdir -p $TutorialDir
cp -r $DataDir/* $TutorialDir
cd $TutorialDir
cp -r input working_dir
cd working_dir
Option B — Downloading the archive
12.2.2. Equilibrium Bookending
First we take an equilibrium approach. Jarzynski[1] Suppose you want to calculate a change in free energy via an alchemical pathway using an ab initio, semi-empirical, or MLP method rather than a molecular mechanical force field.
Unlike a molecular mechanical force field, one can’t directly sample quantum mechanical methods in an alchemical pathway (which may require fractional nuclear charges and fractional numbers of electrons as atoms appear or disappear).
To overcome this limitation, one uses an “indirect” reference potential approach, whereby the free energy is calculated with the low-level force field that is fast enough to sample the transformation for an extended period of time with multiple trials, and the high-level QM contribution to the free energy is calculated as a correction to the physical end-states. Giese and York[2] A depiction of the bookend corrections is shown in the following figure.
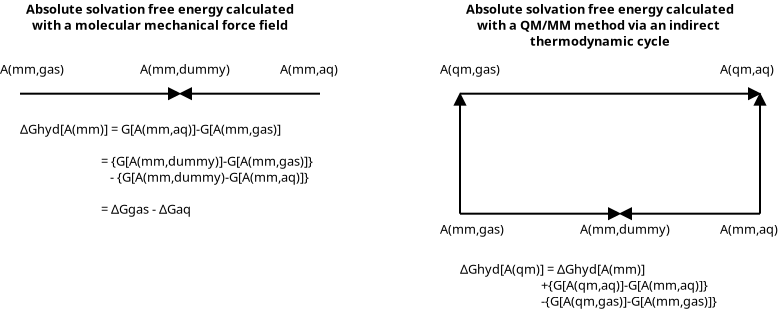
The left-side of the figure shows a thermodynamic cycle for calculating an absolute solvation free energy using a MM force field. The equation below it is the mathematical representation of the cycle. The “cycle” performs real-to-dummy state transformations in two environments: aqueous phase and gas phase. The direction of the arrows is chosen so the lambda=0 and lambda=1 states are the real and dummy states, respectively. The right-side shows how to calculate the hydration free energy using a QM/MM method. The complicated alchemical sampling is performed with the MM force field and the MM-to-QM/MM transformations correct the real-state free energies. These “bookend” corrections can be run with far less sampling because there are no chemical or alchemical changes.
The bookend transformations transform the potential energy from a MM force field to a QM/MM potential. A bookend transformation is required for each “real state”. Mathematically, it is given by the following equation
where “tgt” and “ref” denote the target and reference environments.
For the sake of this exercise, we will assume the underlying absolute solvation free energy calculation that we want to correct has already been performed. In this example, our QM method will be the QDπ machine learning potential. This is a Δ machine learning potential trained to correct GFN2-xTB to the ωB97M-D3BJ/def2-TZVPPD level for drug-like molecules.
12.2.2.1. Preparing the input files
The bookend free energy simulations are simple, linear transformations U(λ)=U(0)+λ[U(1)-U(0)] performed with sander. The free energy infrastructure in sander is different from pmemd. In general, sander uses a groupfile to read the λ=0 and λ=1 states from 2 corresponding sets of mdin, rst7, and parm7 files.
The package includes files used to calculate Eq. 1 for cyclopentane in which a MM potential is transformed to GFN2-xTB QM/MM with QDπ2 machine learning corrections. Zeng et al.[3]
If you are running the tutorial somewhere other than the cluster, download the input files from the link above and unpack them in your working directory.
cd Equilibrium
ls
common edgembar-bookend2dats.py init prod01 prod02 prod03 prod04 sub.ana.slurm sub.testrun.slurm template test_run
ls prod01/aq/prod
mm.0.00.mdin  mm.0.75.mdin            mm2qmmm.0.25.groupfile  mm2qmmm.1.00.groupfile  qm.0.50.mdin
mm.0.25.mdin  mm.1.00.mdin            mm2qmmm.0.50.groupfile  qm.0.00.mdin            qm.0.75.mdin
mm.0.50.mdin  mm2qmmm.0.00.groupfile  mm2qmmm.0.75.groupfile  qm.0.25.mdin            qm.1.00.mdin
Within each trial’s prod directory are necessary inputs for running the mm and qm/mm simulations in aq and vac environments.
The groupfile should contain 2 lines. The first line is the MM (λ=0) state. The second is the QM/MM (λ=1) state. A separate groupfile is used for each value of clambda. It is often sufficient to use 5 lambda values: 0.00 0.25 0.50 0.75 1.00. Notice that both states read the exact same input coordinates. Take a look at test_run/vac/equil/mm2qmmm.0.00.groupfile:
-O -p ../../../common/vac.parm7 -i mm.0.00.mdin -o mm.0.00.mdout -c init.0.00.rst7 -r mm.0.00.rst7 -x mm.0.00.nc -inf mm.0.00.mdinfo
-O -p ../../../common/vac.parm7 -i qm.0.00.mdin -o qm.0.00.mdout -c init.0.00.rst7 -r qm.0.00.rst7 -x qm.0.00.nc -inf qm.0.00.mdinfo
The mdin file should activate the free energy infrastructure (ifce=1). There are 2 mdin files for each value of clambda (the MM and QM/MM states).
Example MM and QM/MM template mdin files are shown below. The QM/MM mdin file should be the same thing as the MM mdin file; however, one sets ifqnt=1 rather than ifqnt=0. We also enable deep potential range correction (dprc=1) for the QM/MM input file to create the molecule with the QDπ machine learning potential. Furthermore, the MM and QM/MM simulations both don’t need to write a trajectory file because they both encounter the same sets of coordinates, so one should set ntwx=0 in the QM/MM mdin file while setting ntwx to the desired print frequency in the MM mdin file.
Equilibrium TI analysis
&cntrl
! IO =======================================
    irest = 1       ! 0 = start, 1 = restart
        ntx = 5       ! 1 = start, 5 = restart
    ntxo = 1       ! read/write rst as formatted file
    iwrap = 1       ! wrap crds to unit cell
    ioutfm = 1       ! write mdcrd as netcdf
    ntpr = 10      ! mdout print freq
    ntwx = 0       ! mdcrd print freq
    ntwr = 500     ! rst print freq
    ntwv = 0
! DYNAMICS =================================
! - - ATTN: the 2 fs timestep only works if the parm7 was modified with hydrogen mass repartitioning - -
    imin = 0       ! Run dynamics
        dt = 0.002   ! ps/step
    nstlim = 5000   ! number of time steps (per simulation)
        ntb = 1       ! 1=periodic box
! TEMPERATURE ==============================
    temp0 = 298     ! target temp
gamma_ln = 5.0     ! Langevin collision freq
        ntt = 3       ! thermostat (3=Langevin)
! Use middle scheme rather than the default leapfrog integrator
! so the middle scheme people dont complain. Supposedly its more stable.
!        ntt = 0
!    ischeme = 1       ! middle scheme
!ithermostat = 1       ! Langevin
!therm_par   = 5.0     ! Langevin collision freq
! PRESSURE  ================================
        ntp = 0        !0=off 1=isotropic scaling
!       taup = 2.0     ! pressure relaxation time
!      pres0 = 1.013   ! pressure (bar), 1.013 bar/atm
!   barostat = 1       ! barostat (1=Berendsen, 2=MC)
! SHAKE ====================================
        ntc = 2       ! 1=no shake, 2=HX constrained, 3=all constrained
        ntf = 1       ! 1=cpt all bond E, 2=ignore HX bond E, 3=ignore all bond E
noshakemask=':1'
! MISC =====================================
        cut = 10
        ig = -1
     ifqnt = 0
! TI =======================================
    icfe = 1 ! interpret groupfile as being a FE simulation; first group is MM, second is QM/MM
    clambda = 0.00 ! Manually set lambda. 0=MM, 1=QM/MM
    ifmbar = 1 ! print the lam=0 and lam=1 energies
bar_intervall = 10
bar_l_min   = 0
bar_l_max   = 1
bar_l_incr  = 1
    dynlmb = 0
    ntave = 0
/

&ewald
dsum_tol = 1.e-6
/

&qmmm
    qm_theory   = 'XTB'
        qmmask  = ':1'
    qmcharge  = 0
        spin  = 1
    qmshake  = 0
    qm_ewald  = 1
qmmm_switch  = 1
    scfconv  = 1.e-10
    verbosity  = 0
tight_p_conv  = 1
diag_routine  = 0
pseudo_diag  = 1
dftb_maxiter  = 100
/

&xtb
qm_level="GFN2-xTB"
/

&dprc
idprc=0
mask=":1"
rcut=0.0
intrafile(1) = "../../../common/qdpi2.pb"
/
Equilibrium TI analysis
&cntrl
! IO =======================================
    irest = 1       ! 0 = start, 1 = restart
        ntx = 5       ! 1 = start, 5 = restart
    ntxo = 1       ! read/write rst as formatted file
    iwrap = 1       ! wrap crds to unit cell
    ioutfm = 1       ! write mdcrd as netcdf
    ntpr = 10      ! mdout print freq
    ntwx = 0       ! mdcrd print freq
    ntwr = 500     ! rst print freq
    ntwv = 0
! DYNAMICS =================================
! - - ATTN: the 2 fs timestep only works if the parm7 was modified with hydrogen mass repartitioning - -
    imin = 0       ! Run dynamics
        dt = 0.002   ! ps/step
    nstlim = 5000   ! number of time steps (per simulation)
        ntb = 1       ! 1=periodic box
! TEMPERATURE ==============================
    temp0 = 298     ! target temp
gamma_ln = 5.0     ! Langevin collision freq
        ntt = 3       ! thermostat (3=Langevin)
! Use middle scheme rather than the default leapfrog integrator
! so the middle scheme people dont complain. Supposedly its more stable.
!        ntt = 0
!    ischeme = 1       ! middle scheme
!ithermostat = 1       ! Langevin
!therm_par   = 5.0     ! Langevin collision freq
! PRESSURE  ================================
        ntp = 0        !0=off 1=isotropic scaling
!       taup = 2.0     ! pressure relaxation time
!      pres0 = 1.013   ! pressure (bar), 1.013 bar/atm
!   barostat = 1       ! barostat (1=Berendsen, 2=MC)
! SHAKE ====================================
        ntc = 2       ! 1=no shake, 2=HX constrained, 3=all constrained
        ntf = 1       ! 1=cpt all bond E, 2=ignore HX bond E, 3=ignore all bond E
noshakemask=':1'
! MISC =====================================
        cut = 10
        ig = -1
    ifqnt = 1
! TI =======================================
    icfe = 1 ! interpret groupfile as being a FE simulation; first group is MM, second is QM/MM
    clambda = 0.00 ! Manually set lambda. 0=MM, 1=QM/MM
    ifmbar = 1 ! print the lam=0 and lam=1 energies
bar_intervall = 10
bar_l_min   = 0
bar_l_max   = 1
bar_l_incr  = 1
    dynlmb = 0
    ntave = 0
/

&ewald
dsum_tol = 1.e-6
/

&qmmm
    qm_theory   = 'XTB'
        qmmask  = ':1'
    qmcharge  = 0
        spin  = 1
    qmshake  = 0
    qm_ewald  = 1
qmmm_switch  = 1
    scfconv  = 1.e-10
    verbosity  = 0
tight_p_conv  = 1
diag_routine  = 0
pseudo_diag  = 1
dftb_maxiter  = 100
/

&xtb
qm_level="GFN2-xTB"
/

&dprc
idprc=1
mask=":1"
rcut=0.0
intrafile(1) = "../../../common/qdpi2.pb"
/
12.2.2.2. Running the simulations
In practice, you should equilibrate each lambda state and perform multiple trials of production. For the sake of this workshop, you will run a short vacuum phase equilibration run for the λ=0 state in the test_run directory, but you will analyze the output from the 4 production trials provided for you.
Take a look at sub.testrun.slurm:
#!/bin/bash
#SBATCH --job-name="EqBookend"
#SBATCH --output="sub.sims.%j.slurmout"
#SBATCH --error="sub.sims.%j.slurmerr"
#SBATCH --qos=regular
#SBATCH --nodes=1
#SBATCH --ntasks=2
#SBATCH --cpus-per-task=1
#SBATCH --mem=6G
#SBATCH -t 0:10:00
#SBATCH --partition=general

set -e
set -u

module load Miniforge3
module load ambertools/ambertools-xtb-deepmd-tensorflow

export DP_INTRA_OP_PARALLELISM_THREADS=1
export DP_INTER_OP_PARALLELISM_THREADS=1
export OMP_NUM_THREADS=1

cd test_run/vac/equil

time mpirun -n 2 sander.MPI -ng 2 -groupfile mm2qmmm.0.00.groupfile
Submit the job, which should only take a few minutes.
sbatch sub.testrun.slurm
As the simulation is running, you should see that your mdout files will contain the values of U(0) and U(1) in the MBAR energy analysis output that you can use to analyze the free energy. The potential energy of an arbitrary λ state is directly calculated from these values: U = λ U(0) + (1-λ) U(1). The “DVDL” values are similarly calculated: dU(λ)/dλ=U(1)-U(0).
Verify that you have obtained the free energy readout in the mdout file:
INSERT

MBAR Energy analysis:
Energy at 0.0000 =        18.129076
Energy at 1.0000 =   -123405.562149
Now you understand the fundamental infrastructure for running a bookending calculation, which would enable you to perform a full run with additional time and resources.
12.2.2.3. Analyzing the results
Now you will analyze the output of a full, multitrial run provided in the prod01-prod04 directories.
To perform TI analysis, one must extract the ∂U/∂λ time series from the simulations of each λ-state in each environment (aq or vac) and trial (prod01, prod02, prod03, prod04). Similarly, MBAR analysis requires the potential energy of each state, U(r;λ’). Because this is a linear transformation, the potential energy of any intermediate state can be computed from the λ=0 and λ=1 states. Furthermore, the MBAR analysis only requires potential energy differences, so we will obtain the same free energy if – for each frame, k – we define the zero of energy to be UMM(rk). In which case, the potential energy of state λ’ evaluated at frame k within the ensemble of state λ is given below.
The production mdout files contain lines that look like:
MBAR Energy analysis:
Energy at 0.0000 =    -34058.898273
Energy at 1.0000 =   -157487.012014
------------------------------------------------------------------------------


NSTEP =     5000   TIME(PS) =    4050.000  TEMP(K) =   295.09  PRESS =     0.0
Etot   =    -59509.0059  EKtot   =      5406.9208  EPtot      =    -64915.9267
BOND   =         2.5352  ANGLE   =         5.1064  DIHED      =         6.6360
1-4 NB =         0.6406  1-4 EEL =        -1.6434  VDWAALS    =      6435.6533
EELEC  =    -40512.8633  EHBOND  =         0.0000  RESTRAINT  =         0.0000
DV/DL  =   -123428.1137
Ewald error estimate:   0.2884E-02
------------------------------------------------------------------------------
This example shows a sample within
prod01/aq/prod/mm.0.25.mdout. That is, it is a sample
from the λ=0.2 ensemble within the first trial performed in solution.
The ∂U/∂λ value is -123428.1137 kcal/mol (the number after DV/DL).
The sub.ana.slurm slurm submission file uses the
edgembar-bookend2dats.py script (a part of FE-ToolKit) to extract the
relevant data from the mdout files and use edgembar to perform the
analysis. The “bookend-to-dats” script takes a list of mdout filenames
(e.g. prod01/aq/prod/mm.*.mdout) extracts the DV/DL data from each
file, and writes the TI and MBAR timeseries in a format that can be
analyzed using the edgembar program. The extracted
outputs are written to a series of files:
analysis/mm~qmmm/``env``/``trial``/dats/efep_``tlam``_``elam``.dat
and
analysis/mm~qmmm/``env``/``trial``/dats/dvdl_``tlam``.dat,
where env is either aq or vac, trial is either t01, t02, t03, or
t04, tlam is the lambda value used to simulate the trajectory, and
elam is the lambda value corresponding to the energy within the file.
The sub.ana.slurm script then creates an XML input file to run
edgembar. The XML file is provided as
mm2qmmm/analysis/xml/mm~qmmm.xml.
You can find more information on the form of the efep_*.dat and dvdl_*.dat data files <https://rutgerslbsr.gitlab.io/fe-toolkit/edgembar/edgecalc.html#RawData> and edgembar program at the associated links.
One could prepare edgembar XML input files to correct MM results with the bookend simulation data by introducing them as an additional stage; however, in the above example, the MM ligand is called “mm” and the QM/MM ligand “qmmm”. If it were included as an additional stage, then the reported edge free energy of each ligand is the QM/MM-corrected value. If it is included as a separately-named ligand, then one can see the MM and bookend-correction as separate free energy values in the graph analysis.
Submit the analysis, which should take a few minutes to run:
sbatch sub.ana.slurm
You should see the analysis directory populated with mm~qmmm and xml subdirectories. The edgembar XML file (analysis/xml/mm~qmmm.xml) is organized as follows:
<?xml version="1.0" ?>
<edge name="mm~qmmm">
    <env name="target">
        <stage name="STAGE">
            <trial name="t01">
                <dir>mm~qmmm/aq/t01/dats</dir>
                <ene>0.00000000</ene>
                <ene>0.25000000</ene>
                <ene>0.50000000</ene>
                <ene>0.75000000</ene>
                <ene>1.00000000</ene>
            </trial>
            <trial name="t02">
                <dir>mm~qmmm/aq/t02/dats</dir>
                <ene>0.00000000</ene>
                <ene>0.25000000</ene>
                <ene>0.50000000</ene>
                <ene>0.75000000</ene>
                <ene>1.00000000</ene>
            </trial>
            <trial name="t03">
                <dir>mm~qmmm/aq/t03/dats</dir>
                <ene>0.00000000</ene>
                <ene>0.25000000</ene>
                <ene>0.50000000</ene>
                <ene>0.75000000</ene>
                <ene>1.00000000</ene>
            </trial>
            <trial name="t04">
                <dir>mm~qmmm/aq/t04/dats</dir>
                <ene>0.00000000</ene>
                <ene>0.25000000</ene>
                <ene>0.50000000</ene>
                <ene>0.75000000</ene>
                <ene>1.00000000</ene>
            </trial>
        </stage>
    </env>
    <env name="reference">
        <stage name="STAGE">
            <trial name="t01">
                <dir>mm~qmmm/vac/t01/dats</dir>
                <ene>0.00000000</ene>
                <ene>0.25000000</ene>
                <ene>0.50000000</ene>
                <ene>0.75000000</ene>
                <ene>1.00000000</ene>
            </trial>
            <trial name="t02">
                <dir>mm~qmmm/vac/t02/dats</dir>
                <ene>0.00000000</ene>
                <ene>0.25000000</ene>
                <ene>0.50000000</ene>
                <ene>0.75000000</ene>
                <ene>1.00000000</ene>
            </trial>
            <trial name="t03">
                <dir>mm~qmmm/vac/t03/dats</dir>
                <ene>0.00000000</ene>
                <ene>0.25000000</ene>
                <ene>0.50000000</ene>
                <ene>0.75000000</ene>
                <ene>1.00000000</ene>
            </trial>
            <trial name="t04">
                <dir>mm~qmmm/vac/t04/dats</dir>
                <ene>0.00000000</ene>
                <ene>0.25000000</ene>
                <ene>0.50000000</ene>
                <ene>0.75000000</ene>
                <ene>1.00000000</ene>
            </trial>
        </stage>
    </env>
</edge>
The xml file describes the directory structure to locate the efep_*_*.dat and dvdl_*.dat files within the analysis/ directory. The name of the edge is “mm~qmmm”. There are two environments: “target” is the solvated phase and “reference” is the gas phase. The free energy simulations involved a single stage, which we simply name “STAGE”. We performed 4 trials with 5
In this case, you don’t have to reverse the sign of the bookend states because edgembar aligns the “arrows in the thermodynamic cycle” by the transformation name, e.g., “mm~qmmm”. You WOULD need to reverse the states if the transformation name was “qmmm~mm”.
After generating the XML file, the sub.ana.slurm script next runs edgembar_omp –no-auto xml/mm~qmmm.xml to produce xml/mm~qmmm.py. Next, it runs python3 xml/mm~qmmm.py to generate mm~qmmm.html, which provides a full report of the result. You can download this file to your local computer and open it in a browser:
rsync user@hyperion.sw.ehu.es:/PATH2/HandsOn12-Bookend_inputs/Equilibrium/analysis/xml/mm~qmmm.html ./
google-chrome mm~qmmm.html
The page should look like this:
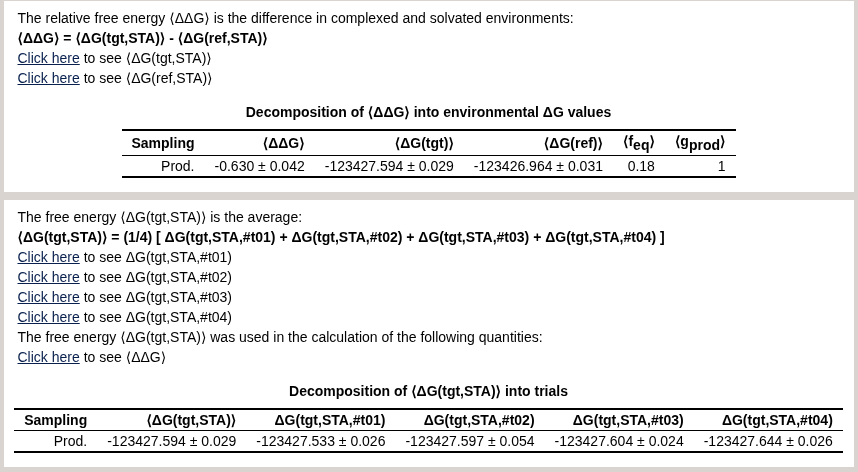
We see the bookending correction is -0.63 kcal/mol. For convenience, we have also uploaded the html report here: mm~qmmm.html.
12.2.3. Non-Equilibrium Bookending
In the previous section we used an equilibrium approach by performing discrete simulations at intermediate λ values. The present activity calculates the correction by analyzing nonequilibrium sampling with Jarzynski’s equality. Jarzynski[4] Nonequilibrium sampling in this context means that the alchemical coordinate is time-dependent λ(t). Specifically, λ uniformly scales from λmin-to-λmax (typically 0-to-1) during the course of a simulation – a so-called “switching simulation”.
A brief overview of the procedure is:
Perform a MM simulation and periodically save the coordinates and velocities to the trajectory file
For each frame, perform a short MM-to-QM/MM switching simulation
Each switching simulation produces a single “work value”
Calculate the free energy from the collection of work values using Jarzynski’s equality.
The functional form of Jarzynski’s equality is quite similar to exponential averaging encountered in equilibrium simulation.
The angle brackets represent an average over many switching simulations whose starting coordinates are drawn from the MM ensemble (the ensemble of the λ=0 state). Each switching simulation produces a single “work value”, W.
In practice, the time integration is discretized τ = ∆t×nstlim, where ∆t is the time step and nstlim is the number of steps. If one assumes that the masses are independent of λ, then H(r(t);λ(t)) can be replaced with U(r(t);λ(t)), and the work can be expressed by the following summation. The time steps are indexed from 0 to nstlim-1, such that the elapsed time at step n is t=n∆t.
The derivative is the thermodynamic gradient normally used to evaluate the free energy from thermodynamic integration; however, it only contributes to the nonequilibrium work when λ changes between consecutive time steps. In sander, the time dependence of λ is controlled with the dynlmb and ntave variables. Specifically, the value of λ is incremented by dynlmb once every ntave steps. If nstlim is an integer multiple of ntave, then λ will be incremented a total of Nincr = nstlim/ntave times, and each increment increases λ by dynlam = (λmax−λmin)/Nincr. One can rewrite the summation to include only the subset of samples contributing a nonzero value to the work (i.e., the samples whose time step is a multiple of ntave)
12.2.3.1. The MM (λ=0) simulation
Navigate to the Non-Equilibrium directory for this exercise:
cd PATH2/HandsOn12-Bookend_inputs/Non-Equilibrium
ls
MM_MD  common  edgembar-bookend2dats.py  init  prod01  prod02  prod03  prod04  sub.ana.slurm  sub.testrun.slurm  template  test_run
The switching simulations need an ensemble of MM starting configurations. These have already been performed for you in the MM_MD directory. You often need 500-or-more starting structures. When running the MM simulation, you should save both the coordinates and velocities to the trajectory file. You can do this by setting ntwv=-1 and ntwx=N, where N is the number of steps between writes to the trajectory file. It’s often better to run the MM simulation for longer and write to the trajectory file infrequently so your trajectory contains statistically independent samples and your trajectory adequately samples the MM landscape.
Each switching simulation is completely independent; therefore, if you had access to a large number of processors, you could use cpptraj to write each frame of the trajectory file as a restart file. You could then use each restart file to initiate a switching simulation in a trivially-parallelized manner. On the other hand, this strategy produces an excessive number of files, which is inconvenient to manage.
Alternatively, sander allows you to read a trajectory file (set imin=6 and specify the trajectory file on the command line with the -y option). By setting imin=6, sander will run a simulation departing from each frame of the trajectory file, and all the outputs are effectively concatenated into a single file. For simplicity in this exercise, we will not parallelize the switching simulations and work with single trajectories.
12.2.3.2. Preparing the switching simulation files
The bookend free energy simulations are simple, linear transformations U(λ)=U(0)+λ[U(1)-U(0)] performed with sander. The free energy infrastructure in sander is different from pmemd. In general, sander uses a groupfile to read the λ=0 and λ=1 states from 2 corresponding sets of mdin, rst7, and parm7 files.
The groupfile should contain 2 lines. The first line is the MM (λ=0) state. The second is the QM/MM (λ=1) state. Take a look at test_run/vac/mm2qmmm.groupfile.
-O -p ../../common/vac.parm7 -c init.rst7 -i mm.mdin -o mm.mdout -r mm.rst7 -x tmpmm.nc -inf mm.mdinfo -y ./mm.nc
-O -p ../../common/vac.parm7 -c init.rst7 -i qm.mdin -o qm.mdout -r qm.rst7 -x tmpqm.nc -inf qm.mdinfo -y ./mm.nc
The mdin file should activate the free energy infrastructure (ifce=1). There are 2 mdin files for each value of clambda (the MM and QM/MM states). An example MM template mdin file is shown below. The QM/MM mdin file should be the same thing as the MM mdin file; however, one sets ifqnt=1 rather than ifqnt=0. We set ijarzynski = 1 to perform non-equilibrium work simulations and output the work values.
Non-equilibrium TI analysis
&cntrl
! IO =======================================
    irest = 1       ! 0 = start, 1 = restart
        ntx = 5       ! 1 = start, 5 = restart
    ntxo = 1       ! read/write rst as formatted file
    iwrap = 1       ! wrap crds to unit cell
    ioutfm = 1       ! write mdcrd as netcdf
    ntpr = 1       ! mdout print freq
    ntwx = 0       ! mdcrd print freq
    ntwr = 500     ! rst print freq
    ntwv = 0
! DYNAMICS =================================
! - - ATTN: the 2 fs timestep only works if the parm7 was modified with hydrogen mass repartitioning - -
    imin = 6       ! Run dynamics
        dt = 0.001   ! ps/step
    nstlim = 500     ! number of time steps (per simulation)
        ntb = 1       ! 1=periodic box
! TEMPERATURE ==============================
    temp0 = 298     ! target temp
gamma_ln = 5.0     ! Langevin collision freq
        ntt = 3       ! thermostat (3=Langevin)
! Use middle scheme rather than the default leapfrog integrator
! so the middle scheme people dont complain. Supposedly its more stable.
!        ntt = 0
!    ischeme = 1       ! middle scheme
!ithermostat = 1       ! Langevin
!therm_par   = 5.0     ! Langevin collision freq
! PRESSURE  ================================
        ntp = 0        !0=off 1=isotropic scaling
!       taup = 2.0     ! pressure relaxation time
!      pres0 = 1.013   ! pressure (bar), 1.013 bar/atm
!   barostat = 1       ! barostat (1=Berendsen, 2=MC)
! SHAKE ====================================
        ntc = 2       ! 1=no shake, 2=HX constrained, 3=all constrained
        ntf = 1       ! 1=cpt all bond E, 2=ignore HX bond E, 3=ignore all bond E
noshakemask=':1'
! MISC =====================================
        cut = 10
        ig = -1
    ifqnt = 0
! TI =======================================
    icfe = 1 ! interpret groupfile as being a FE simulation; first group is MM, second is QM/MM
    clambda = 0 ! Manually set lambda. 0=MM, 1=QM/MM
    dynlmb = 0
    ntave = 1 ! Change lambda every step
ijarzynski = 1 ! Setup other input variables automatically and report the final work value
/

&ewald
dsum_tol = 1.e-6
/

&qmmm
    qm_theory   = 'XTB'
        qmmask  = ':1'
    qmcharge  = 0
        spin  = 1
    qmshake  = 0
    qm_ewald  = 0
qmmm_switch  = 1
    scfconv  = 1.e-10
    verbosity  = 0
tight_p_conv  = 1
diag_routine  = 0
pseudo_diag  = 1
dftb_maxiter  = 100
/

&xtb
qm_level="GFN2-xTB"
/

&dprc
idprc=0
mask=":1"
rcut=0.0
intrafile(1) = "../../common/qdpi2.pb"
/
Non-equilibrium TI analysis
&cntrl
! IO =======================================
    irest = 1       ! 0 = start, 1 = restart
        ntx = 5       ! 1 = start, 5 = restart
    ntxo = 1       ! read/write rst as formatted file
    iwrap = 1       ! wrap crds to unit cell
    ioutfm = 1       ! write mdcrd as netcdf
    ntpr = 1       ! mdout print freq
    ntwx = 0       ! mdcrd print freq
    ntwr = 500     ! rst print freq
    ntwv = 0
! DYNAMICS =================================
! - - ATTN: the 2 fs timestep only works if the parm7 was modified with hydrogen mass repartitioning - -
    imin = 6       ! Run dynamics
        dt = 0.001   ! ps/step
    nstlim = 500     ! number of time steps (per simulation)
        ntb = 1       ! 1=periodic box
! TEMPERATURE ==============================
    temp0 = 298     ! target temp
gamma_ln = 5.0     ! Langevin collision freq
        ntt = 3       ! thermostat (3=Langevin)
! Use middle scheme rather than the default leapfrog integrator
! so the middle scheme people dont complain. Supposedly its more stable.
!        ntt = 0
!    ischeme = 1       ! middle scheme
!ithermostat = 1       ! Langevin
!therm_par   = 5.0     ! Langevin collision freq
! PRESSURE  ================================
        ntp = 0        !0=off 1=isotropic scaling
!       taup = 2.0     ! pressure relaxation time
!      pres0 = 1.013   ! pressure (bar), 1.013 bar/atm
!   barostat = 1       ! barostat (1=Berendsen, 2=MC)
! SHAKE ====================================
        ntc = 2       ! 1=no shake, 2=HX constrained, 3=all constrained
        ntf = 1       ! 1=cpt all bond E, 2=ignore HX bond E, 3=ignore all bond E
noshakemask=':1'
! MISC =====================================
        cut = 10
        ig = -1
    ifqnt = 1
! TI =======================================
    icfe = 1 ! interpret groupfile as being a FE simulation; first group is MM, second is QM/MM
    clambda = 0 ! Manually set lambda. 0=MM, 1=QM/MM
    dynlmb = 0
    ntave = 1 ! Change lambda every step
ijarzynski = 1 ! Setup other input variables automatically and report the final work value
/

&ewald
dsum_tol = 1.e-6
/

&qmmm
    qm_theory   = 'XTB'
        qmmask  = ':1'
    qmcharge  = 0
        spin  = 1
    qmshake  = 0
    qm_ewald  = 0
qmmm_switch  = 1
    scfconv  = 1.e-10
    verbosity  = 0
tight_p_conv  = 1
diag_routine  = 0
pseudo_diag  = 1
dftb_maxiter  = 100
/

&xtb
qm_level="GFN2-xTB"
/

&dprc
idprc=1
mask=":1"
rcut=0.0
intrafile(1) = "../../common/qdpi2.pb"
/
12.2.3.3. Running the simulations
In practice you should perform multiple trials of production on long trajectories. For the sake of this exercise you will perform switching simulations for a trajectory of only 3 frames (rather than 500) in the vacuum phase to verify you can obtain the desired output in the test_run directory. The full production runs have already been performed for you in the prod0{1..4} directories like in the previous exercise.
Submit the job, which should only take a few minutes.
sbatch sub.testrun.slurm
Take a look at test_run/vac/mm.mdout and test_run/vac/qm.mdout files. You should see output that looks something like this:
      DV/DL, AVERAGES OVER       1 STEPS


NSTEP =      500   TIME(PS) =       0.500  TEMP(K) =     0.00  PRESS =     0.0
Etot   =         0.0000  EKtot   =         0.0000  EPtot      =   -123429.2573
BOND   =        -4.0350  ANGLE   =        -6.6919  DIHED      =        -9.4573
1-4 NB =        -0.4245  1-4 EEL =         2.1235  VDWAALS    =         0.1686
EELEC  =        -2.7095  EHBOND  =         0.0000  RESTRAINT  =         0.0000
XTBESCF=     -9912.2111
ML =  -113496.0201
DV/DL  =   -123429.2573
Ewald error estimate:   0.0000E+00
------------------------------------------------------------------------------

|===============================================================================

Dynamically changing lambda: Increased clambda by       0.0020 to       1.0000


Final work value:   -123426.913799
You can verify that the output is different from the equilibrium case, and the work value has been printed. In addition, you can see that the λ is dynamically changing during the simulation.
12.2.3.4. Analyzing the results
If you set imin=6 and read a trajectory with the -y option, then there will be multiple occurrences of “Final work value:”. You can simply grep these lines out of the mdout files for analysis. Alternatively, you can use the edgembar-bookend2dats.py script (a part of FE-ToolKit) to read your mdout files, and write the MBAR energies and DVDL values and write the necessary efep_*.dat data files. These data files are the format used by edgembar to calculate the free energy.
The calculation of the free energies from Jarzynski’s equality can use the exact same infrastructure as computing the free energy from exponential averaging. You need to generate 2 files per trial: efep_0.0_0.0.dat and efep_0.0_1.0.dat. The file format efep_A_B.dat means that the file contains the energy of state B for the samples drawn from state A. The efep_0.0_0.0.dat file contains 2 columns: the first column is a float or integer representing the time (or time step), and the second column should be 0.0. The efep_0.0_1.0.dat file also contains 2 columns, and it should have the same number of rows, but the energy values are the work values extracted from the mdout file.
Like the previous exercise, you have been provided sub.ana.slurm to run edgembar analysis on the precomputed production trials. The script is almost identical to the equilibrium case, except the file paths have been adjusted. It will again create dat files that will be mapped by the xml file, then it will generate the summary html file.
Run the analysis and download the resulting analysis/xml/mm~qmmm.html.
sbatch sub.ana.slurm
rsync user@hyperion.sw.ehu.es:/PATH2/HandsOn12-Bookend_inputs/Non-Equilibrium/analysis/xml/mm~qmmm.html ./
google-chrome mm~qmmm.html
The result should look like this:
The page should look like this:
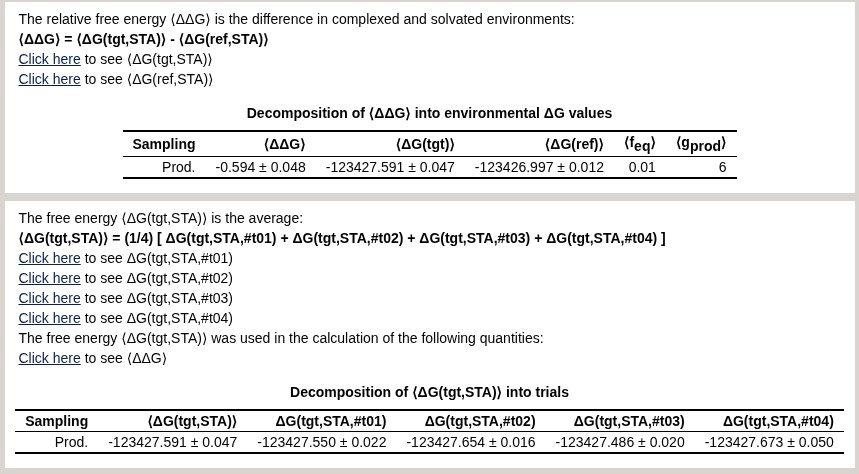
For convenience, we have also uploaded the html report here: mm~qmmm.html.
Verify that the equilibrium and non-equilibrium approaches yield similar results. For reference, the absolute solvation free energy computed from MM was 1.782 kcal/mol. The experimental value is 0.560 kcal/mol, as this molecule is hydrophobic. The equilibrium bookending correction was -0.63 kcal/mol and the non-equilibrium bookending correction was -0.59 kcal/mol, bringing the result closer to the experimental value.
Note
See section “26.1.1. Thermodynamic integration using Sander” in the Amber manual for details on performing equilibrium alchemical free energy simulations with sander. Amber manual
See section “26.7. Nonequilibrium sampling and Jarzynski’s equation” in the Amber manual for details on performing nonequilibrium alchemical free energy simulations with sander. Amber manual