Network-Wide Analysis With FE-Toolkit
Learning objectives
Learn how to read an FE-Toolkit Graph Report
Explore a real FE-Toolkit Graph Report and identify calculation errors.
Introduction to Network-Wide Analysis
FE-Toolkit provides, for RBFE calculations, the ability to perform network-wide analysis for comparing many different Relative Binding Free Energy (RBFE) calculations in a concerted way.
This is done by calling edgembar-WriteGraphHtml.py from FE-Toolkit on the Python files generated during analysis.
Note
An example call for edgembar-WriteGraphHtml.py is included below, but is out of scope for this tutorial.
Running: edgembar-WriteGraphHtml.py -o analysis/Graph.html $(ls analysis/*~*.py)
Examining a Network-Wide Analysis Result
In this activity, you will be working with a set of completed RBFE simulations for Tyk2. These include 16 ligands, with 31 independent simulations forming edges between these ligands.
Open the FE-Toolkit network graph report here: Graph.html
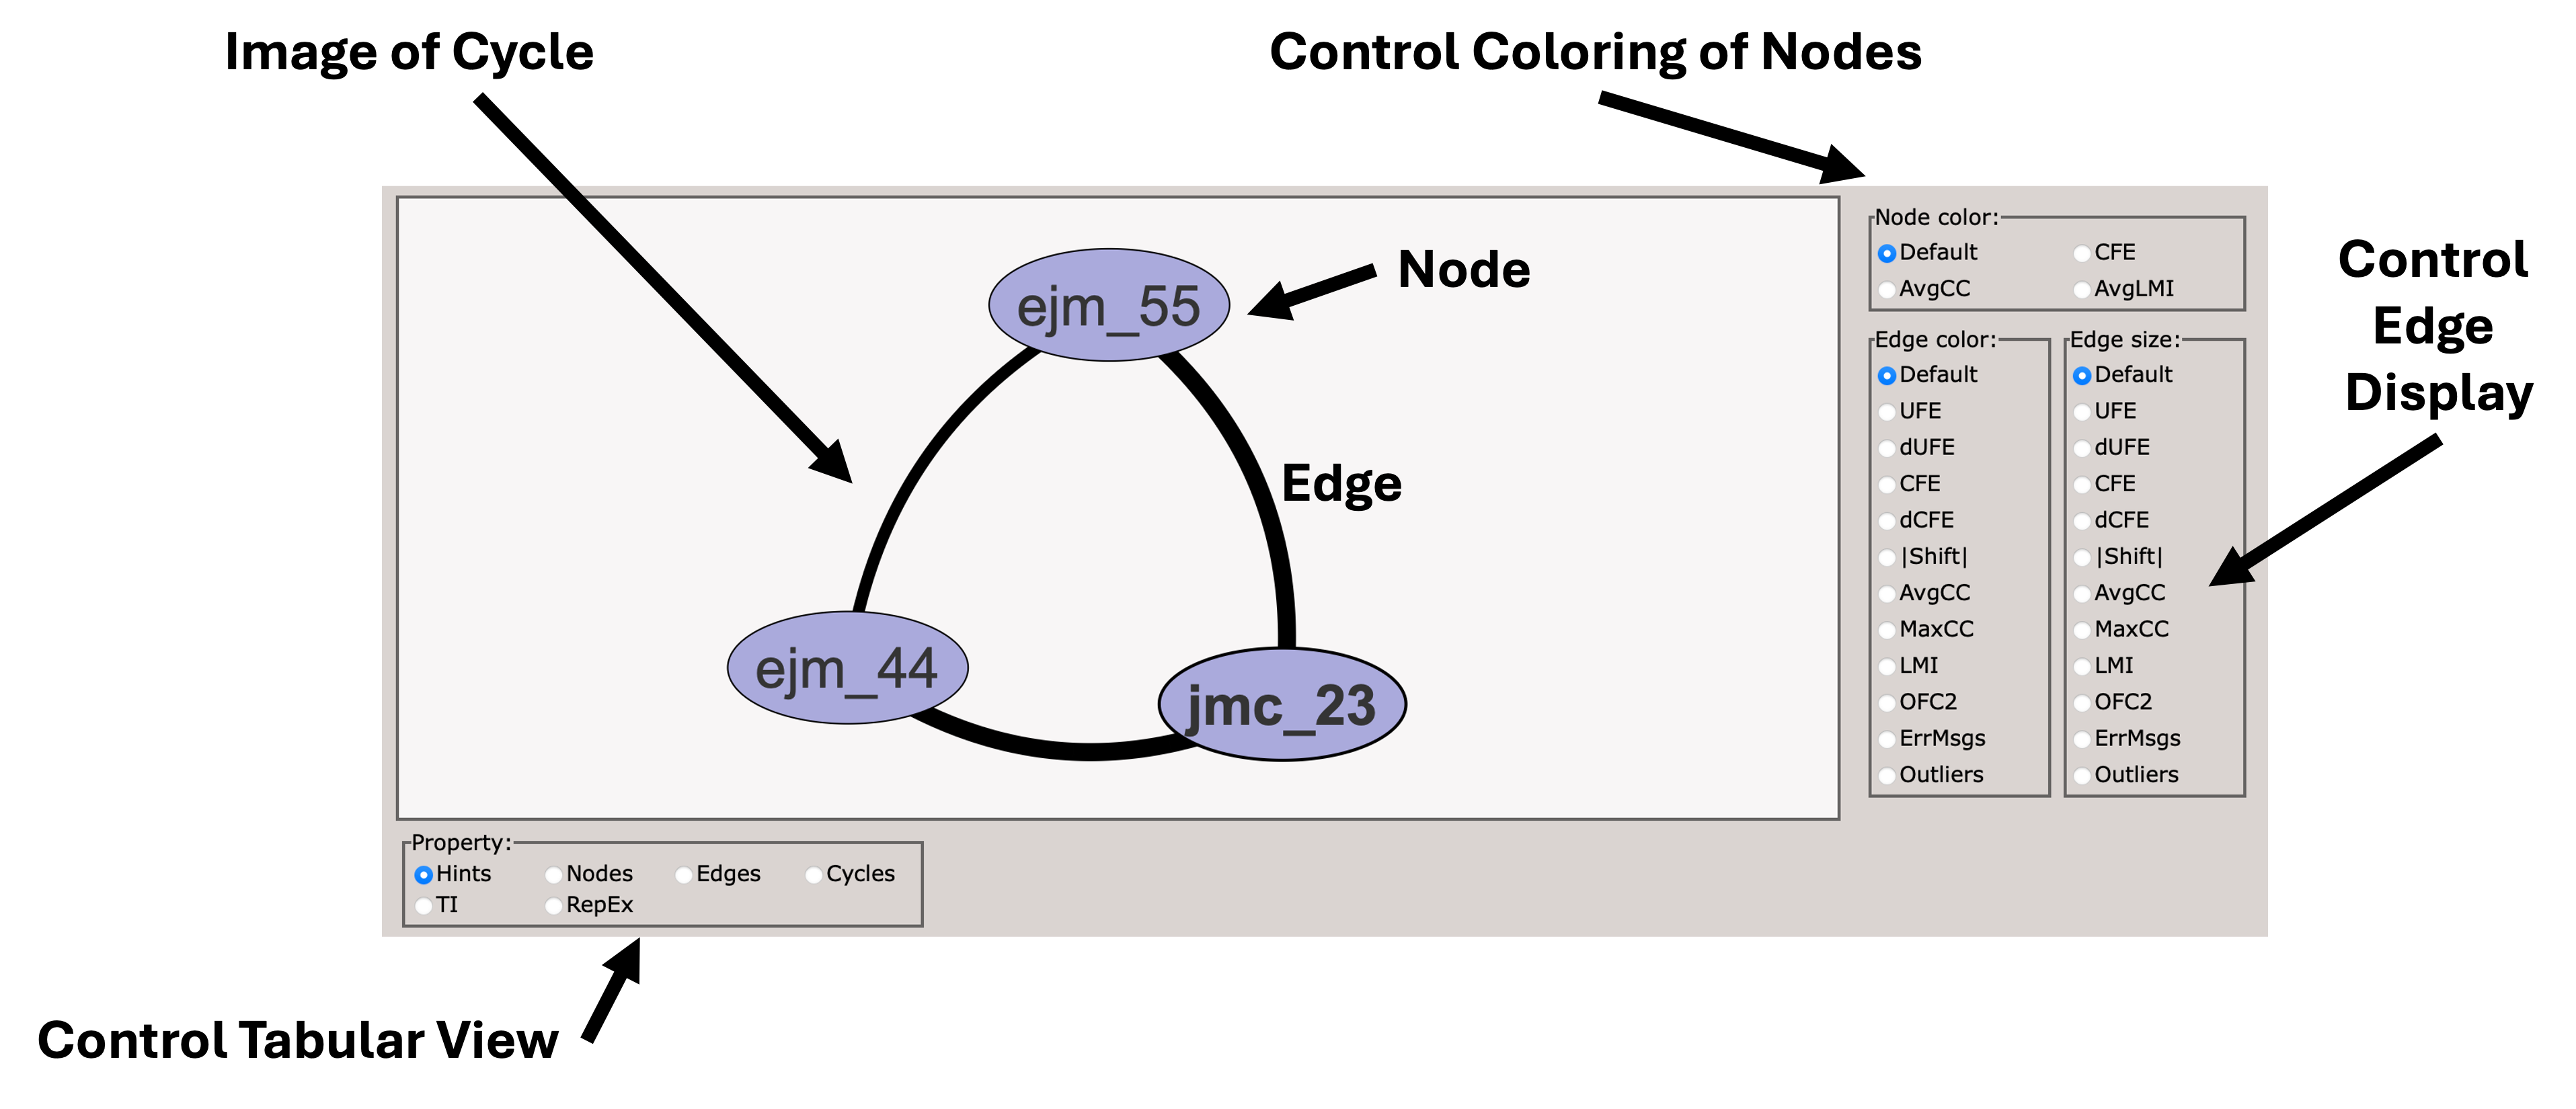
When you first load the HTML file, you will see at the top of the file a map of the RBFE network (in this case three ligands) with a variety of controls.
You can use these controls to customize the display of the results, including the coloring of nodes, and the coloring and thickness of edges based on various metrics.
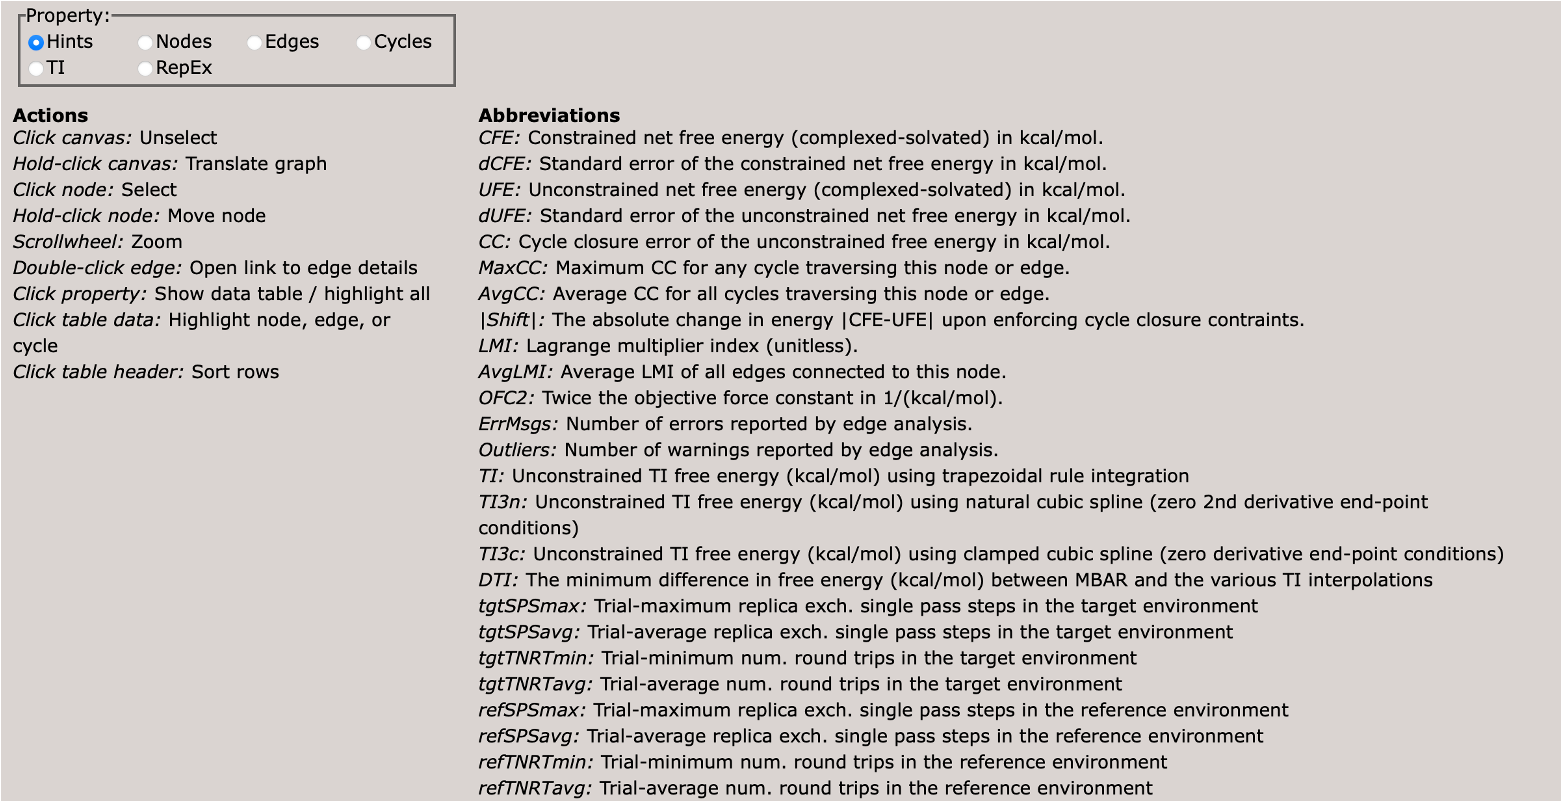
Scrolling down, you will see a control panel that allows you to display a variety of views. The default is a help pane which describes various important abbreviations.
This section describes various important abbreviations used in the graph display.
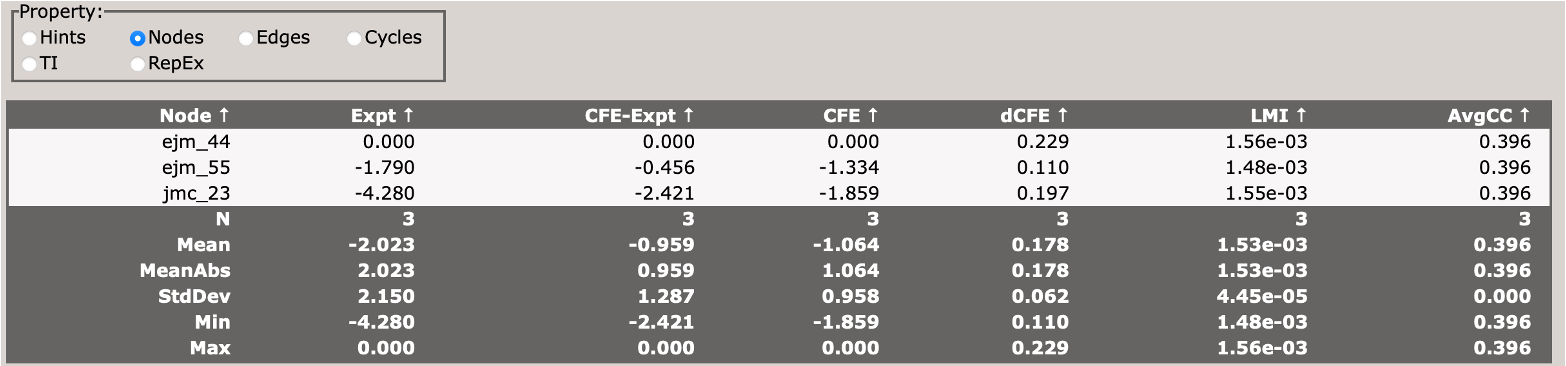
This section describes the free energy of individual nodes (ligands) in the network (relative to an arbitrary reference ligand).
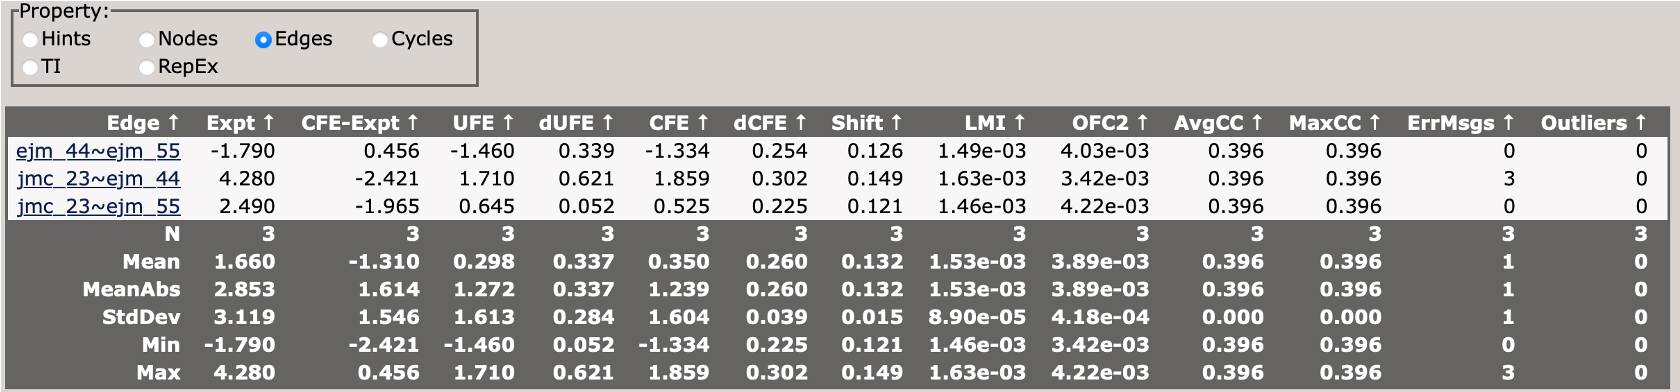
This section describes the free energy differences between pairs of ligands (edges) in the network.
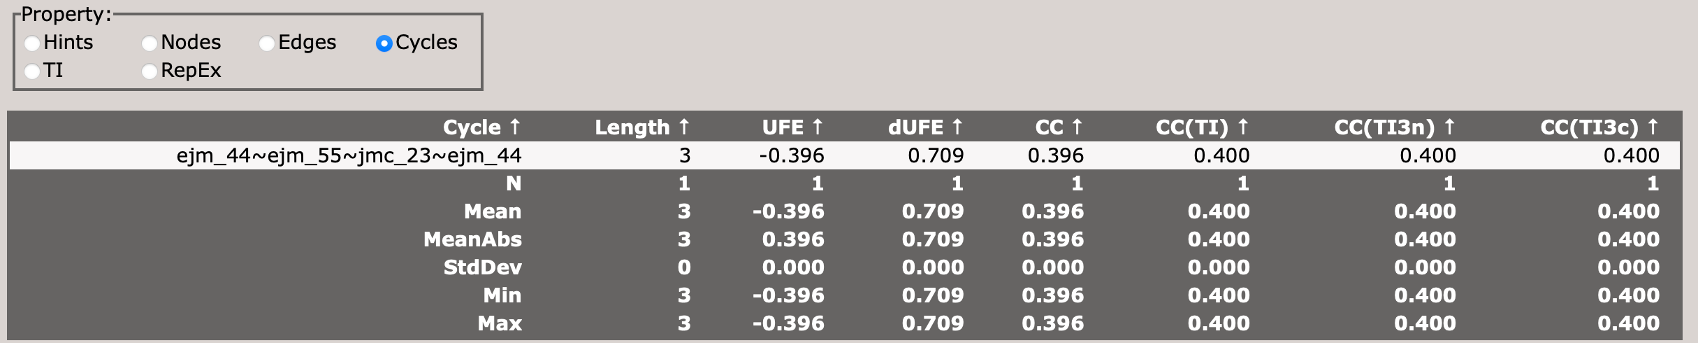
This section describes the cycle closure errors for cycles in the network.
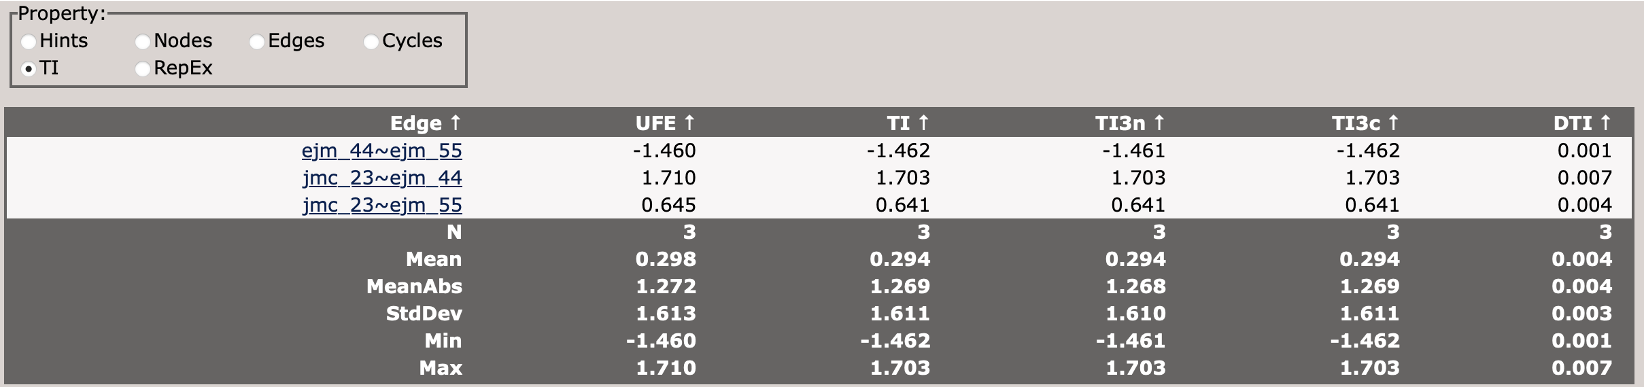
This compares different TI analysis approaches and how well they agree with BAR.
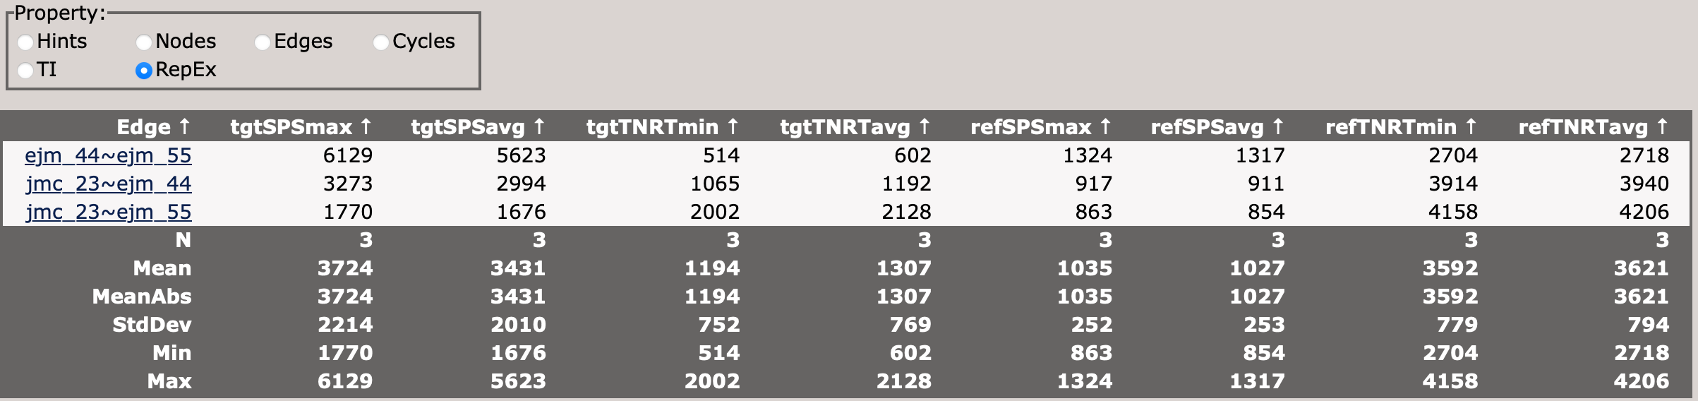
This section describes the replica exchange statistics for each edge in the network.
Now take some time to explore the file, and each tab. Each edge from the network can be accessed from the Edges panel.
With the remainder of your time:
Try to make a plot of the constrained free energy versus experiment. How does the R^2 perform? Is the RMSD reasonable? How close to 1 is the slope?
Color the edges in the main diagram by the maximum cycle closure error. Do any of the ligands stand out to you as problematic? Are there any edges that should be reconsidered and rerun?
Color the edges in the main diagram by ErrMsgs. Open the edge with the worst errors from the Edges panel. Where are those errors coming from? Is it all trials that are having problems, or just one problematic trial?
Look at the cycle closure errors in the Cycles panel. Sort by CC. Which cycle is the worst? Does it include the edge we identified from above?